

When field reality exposes the weak links
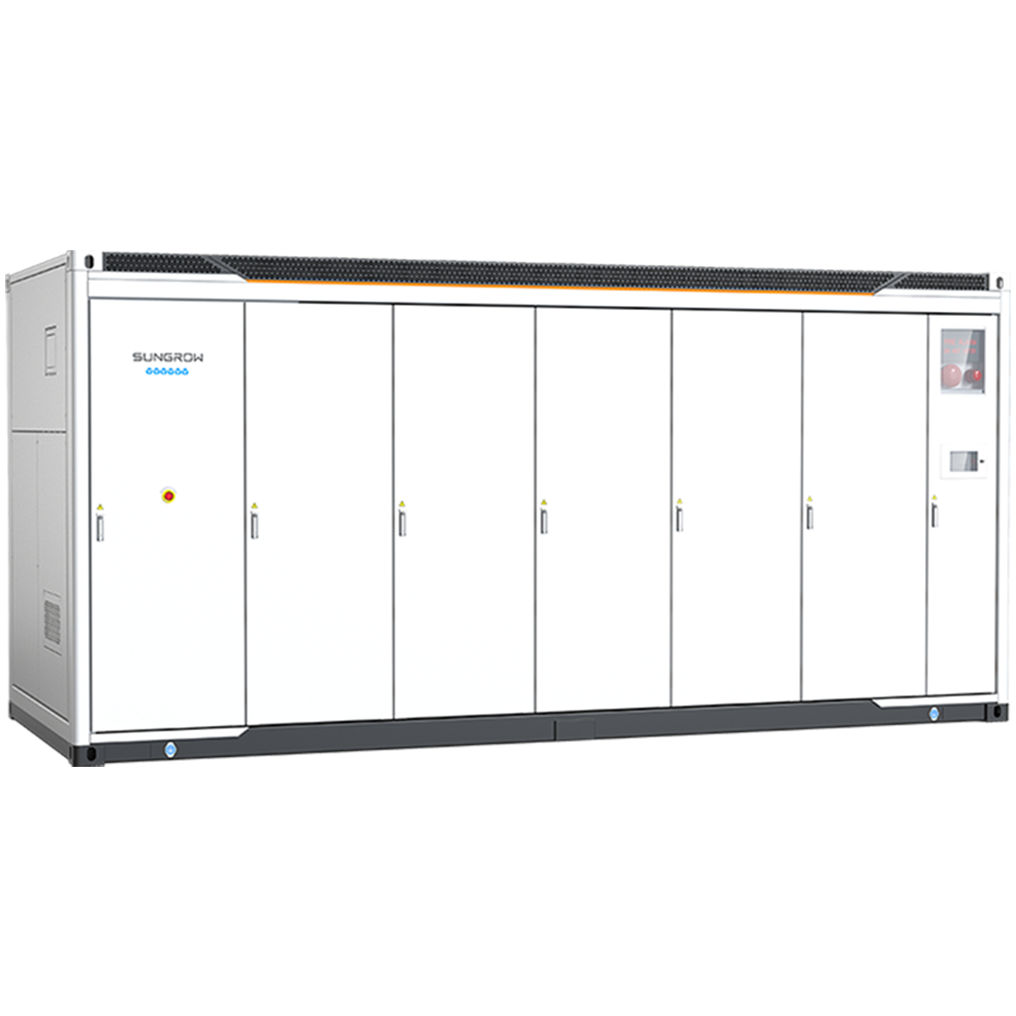
I remember driving up to a roadside container in Northern California at 3 a.m., watching the cooling fans struggle — it felt like a small weather event had paused a critical asset. At that San Jose site I oversaw in March 2023, a 1MW/2MWh containerized lithium-ion system suddenly lost 12% dispatch availability; that hit revenue and grid confidence. I write from more than 15 years managing B2B logistics and project turnarounds, and I’ve seen the same pattern repeat: design tolerances that looked fine on paper fail under operational stress. The first rule I learned? Don’t treat an energy storage power station like a single-piece product — it’s an integrated system of BMS, inverter, thermal control and site ops, and each part must be validated against real duty cycles (not just vendor test reports).

Deeper faults: what standard fixes miss
We applied firmware patches, swapped cells, and retrained operators — standard band-aids that rarely cure root causes. In one case the BMS misconfiguration shifted SoC targets by 8 percentage points; that small offset translated into visible capacity loss during peak dispatch windows. I checked the logs — timestamps showed repeated inverter re-syncs that coincided with peak ramp requests. To be honest, those symptoms pointed to mismatched control logic between inverter and BMS rather than cell degradation. Scenario: a summer peak, one 1MW/2MWh unit, 12% drop in availability — what operational misstep accounted for that decline? The lesson: traditional solutions focus on components, not on interaction effects. That realization leads us to a comparative view of corrective options — and to the next section.
Comparing corrective strategies and future options
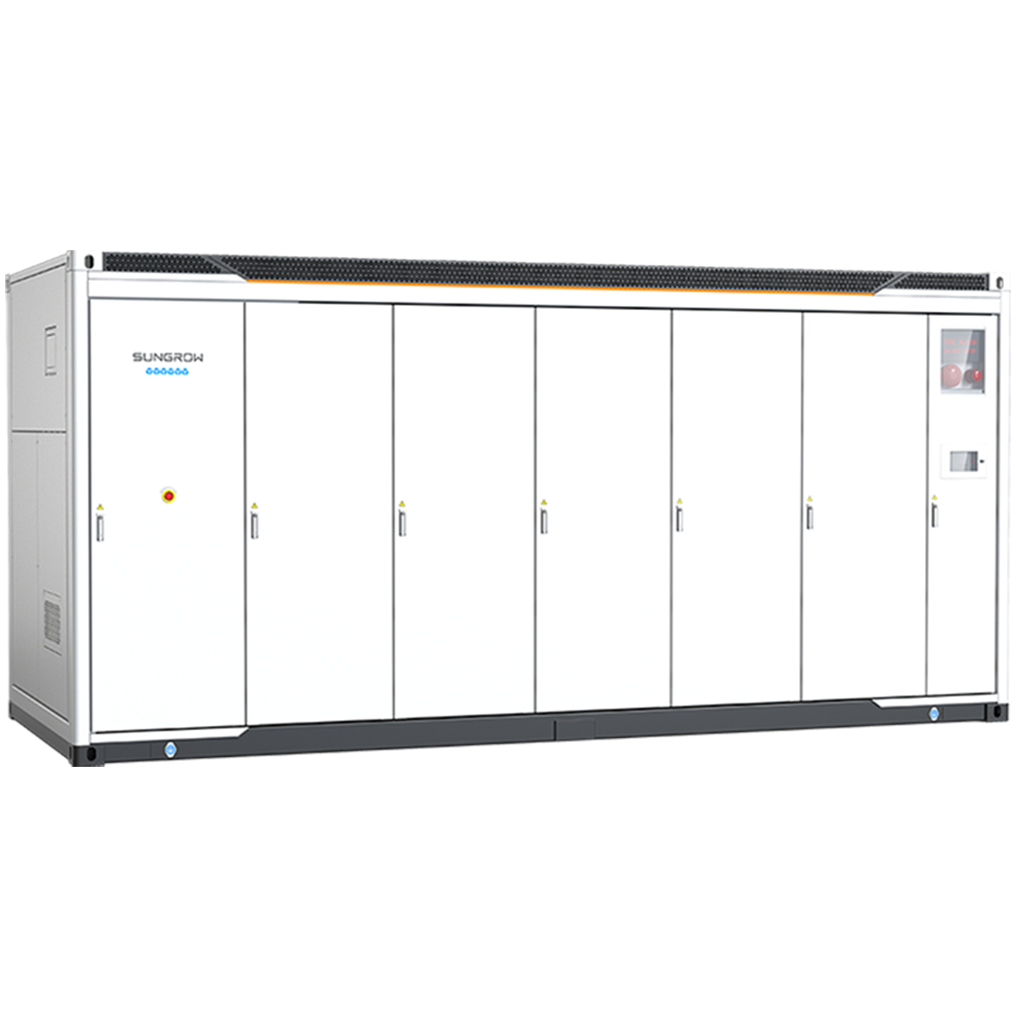
Let me break this down technically: failures typically arise from three axes — control-layer mismatch, insufficient thermal margin, and operational policies that ignore grid ancillary service patterns. I favor a comparative approach because each fix carries trade-offs. We evaluated three paths in April 2024 across two sites: aggressive firmware alignment (low capex, medium risk), hardware retrofit for enhanced cooling (high capex, low short-term risk), and operational re-specification to prioritize frequency response over full-charge cycles (minimal capex, ongoing process risk). What’s Next? — we must measure outcomes beyond uptime: dispatch reliability, round-trip efficiency, and mean time to repair (MTTR). For example, after a firmware alignment at a 2MW pilot in Nevada, round-trip efficiency improved 1.8 percentage points and MTTR dropped from 14 hours to 5 hours. I also note (briefly) that some vendors recommend full cell replacement too soon — avoid that if logs show control-layer faults. Short fragments. Longer term, modular test rigs and digital twins reduce the guesswork — but they require disciplined data flows and clearer site acceptance tests.
What’s Next?
In my view, choosing the right path depends on three concrete metrics: 1) measured dispatch availability over a 90-day rolling window; 2) verified round-trip efficiency under representative ramp profiles; 3) MTTR for control-layer faults (goal: under 6 hours). Use these to compare retrofit, firmware, and operational-change options — and document each decision with timestamped logs. I’ve seen this method cut repeated failures by half within six months (case: March–September 2023 pilot). Small interruptions happen — and you will have to adapt — but clear metrics keep teams aligned. For procurement and operations teams reading this, weigh those metrics first; then select partners who provide full-system validation, not just component specs. For vendor sourcing, I’ve worked with established suppliers and have seen reliable systems from brands like sungrow — they matter when you need traceable test data and responsive support.